


Download Your ‘Total Organic Revenue Potential Dashboard’
Download our ready-to-use dashboard for Google Sheets to calculate both your total organic revenue potential, achievable total organic revenue potential and your current share in minutes.
✅ Plug in your keywords, search volumes, rankings, AOV/CLTV & conversion rate
✅ See your total organic revenue potential and achievable total organic revenue potential
✅ Track your current share and model what impact visibility gains would drive
👉 Get the dashboard
Something that’s not talked about anywhere nearly as often as it should be in SEO is total organic revenue potential.
That’s an estimation of the total amount of revenue that’s there for the taking from organic search, either for an entire brand or one (or more of) of the categories that it trades within.
Keep reading to learn why this is a number you should know, why it’s useful, how to calculate it and, maybe most importantly, how to use it to unlock investment.
What is total organic revenue potential?
Total organic revenue potential is an estimate of how much revenue your business could generate from organic search if you took the top spot for all relevant commercially valuable keywords.
You can also calculate a variant of this, achievable total organic revenue potential,’ which is based on all of these keywords ranking in top 3 positions, rather than all in position #1. The reason being, it’s more realistic to achieve this than absolutely everything being in the top spot.
It’s not about where you are today. At least, not by default, although you can, and should, track what share of this you’re currently getting.
It’s about what’s possible and what your market’s worth; the total addressable revenue opportunity from organic search, based on your numbers (AOV or CLTV and organic conversion rate) alongside monthly search volumes and organic CTRs.
Want an example?
It tells you things like…
- Our total organic revenue potential is £2.11m per month (£25.32m per year)
- Our achievable total organic revenue potential is £1.32m per month (£15.84m per year)
- Right now, our share of total organic revenue potential is 23%.
Think of this as your north star for SEO: a benchmark that helps you and your stakeholders understand just how much is on the table if you get organic growth right.
And you can calculate this for your entire product or service offering, a single category or even a new market. There’s lots of ways this can be used.
This number anchors your strategy in potential value, not just traffic.
It’s a far more accurate and realistic way to calculate what’s on the table than using total monthly search volume.
Why it’s a useful number to know
Most SEO strategies are built around traffic growth. But traffic isn’t usually the end goal; revenue is.
Total organic revenue potential shifts the conversation.
It reframes SEO not as a vague visibility play, but as a measurable commercial opportunity. Instead of saying, “we want to grow organic traffic by 20%”, you can say, “we’re aiming to increase our share of a £15m opportunity.” That’s the type of statement that lands with decision-makers.
This number is also invaluable for:
- Prioritisation: Not all categories are created equal. Revenue potential helps you allocate time, budget, and effort to the areas that could deliver the greatest commercial return; not just those with the most search volume.
- Benchmarking performance: If you’re currently capturing 12% of your achievable total potential, you now have a clear north star. And you can track that share over time to see real progress beyond rankings and sessions.
- Setting goals: Knowing the ceiling makes it easier to set meaningful KPIs; both for a marketing team and for the business. It allows you to define what success could look like, grounded in the market’s real-world value.
- Getting buy-in: Numbers like “£1.32m in achievable monthly potential” speak the language of commercial stakeholders. It’s much easier to get investment in SEO when the upside is quantified.
When you treat SEO like a revenue channel, not just a traffic channel, you start making smarter, more strategic decisions.
And this number is the foundation of that shift.
How to calculate your total organic revenue potential & current share of this
Before we dive into the step-by-step breakdown, based around our FREE dashboard, let’s get clear on what you’ll need as inputs.
➔ An exhaustive list of commercial keywords for your business or category, with monthly search volumes.
➔ Average Order Value (AOV) or Customer Lifetime Value (CLTV); whichever best reflects your business’s revenue model.
➔ Organic conversion rate; ideally based on your actual analytics data for organic traffic.
➔ Current keyword rankings for all of your selected commercial keywords.
With those inputs in place, you’re ready to start calculating the opportunity and the gap between where you are now and where you could be.
Download Your ‘Total Organic Revenue Potential Workbook’
Download our ready-to-use dashboard for Google Sheets to calculate both your total organic revenue potential, achievable total organic revenue potential and your current share in minutes.
✅ Plug in your keywords, search volumes, rankings, AOV/CLTV & conversion rate
✅ See your total organic revenue potential and achievable total organic revenue potential
✅ Track your current share and model what impact visibility gains would drive
👉 Get the dashboard
Step 1: Copy your keyword data into the 📊 Keyword Universe tab
For these calculations to be as accurate as possible, you need an exhaustive commercial keyword list.
I’m talking, as many relevant commercial keywords as you can find. You don’t want to bring in informational queries (e.g. how to X) here; you want keywords that are likely to result in someone buying (e.g. trail running shoes, king size mattress etc). This gives the most accurate representation of the revenue potential.
When I run this, I often end up with thousands of keywords for a full site, and somewhere between hundreds and a thousand or more for individual categories.
You need to make sure your keyword research data includes:
- Keyword
- Category (I group by ‘top-level’ categories of products or services for this – e.g. dresses or women’s clothing depending how large the site is)
- Monthly Search Volume
- Benchmark Rank (grab this from your rank tracker)
Make sure you’ve got all relevant keywords in your keyword universe data; even if you don’t yet have targeted subcategory pages, for example. We’re calculating the potential here, not just filling out based on your site structure.
It’s normal to have lots of ‘-‘ ranked keywords if this is comprehensive enough; it helps you spot where the revenue opportunities are based on your products or services offered, not your site structure.
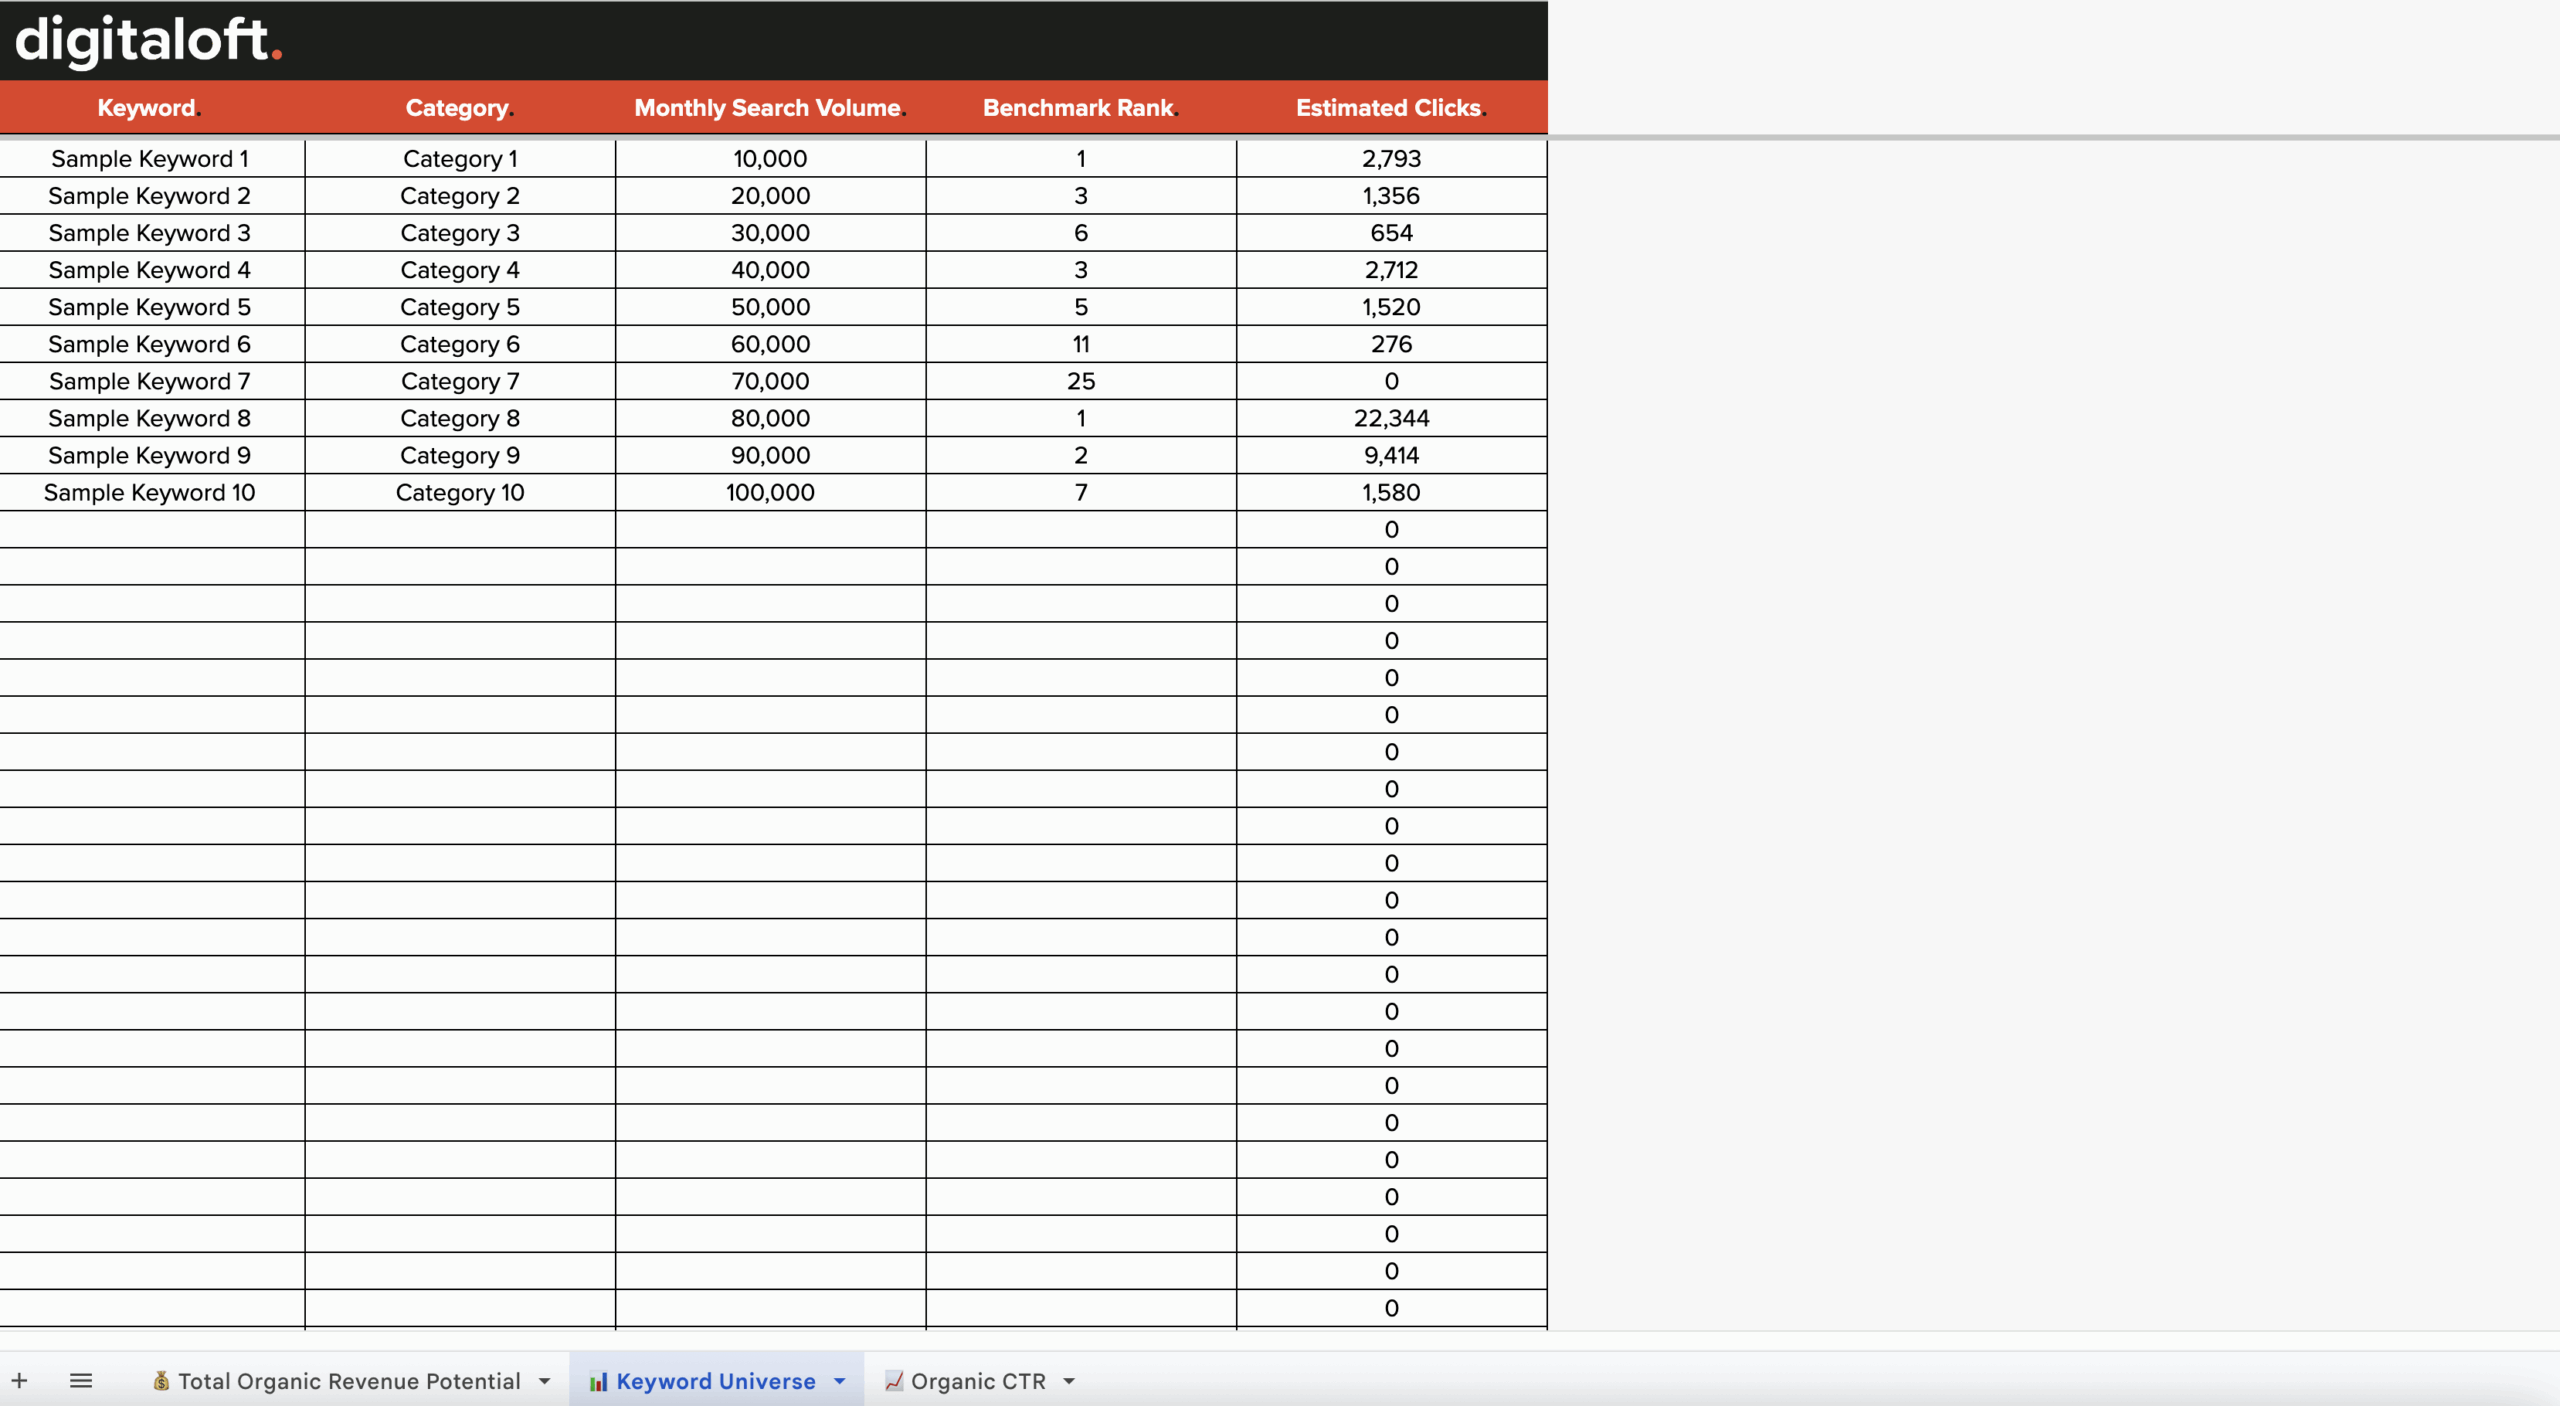
Populate the 📊 Keyword Universe tab on the sheet with this data.
You don’t need to add anything to the ‘estimated clicks’ column, this will populate automatically.
Want to see an example of this fully populated?

Step 2: Add your AOV (or CLTV) and conversion rate data
Make sure you add your own AOV if you’re eCommerce or CLTV if you’re not, and organic conversion rate data at the top of the sheet.
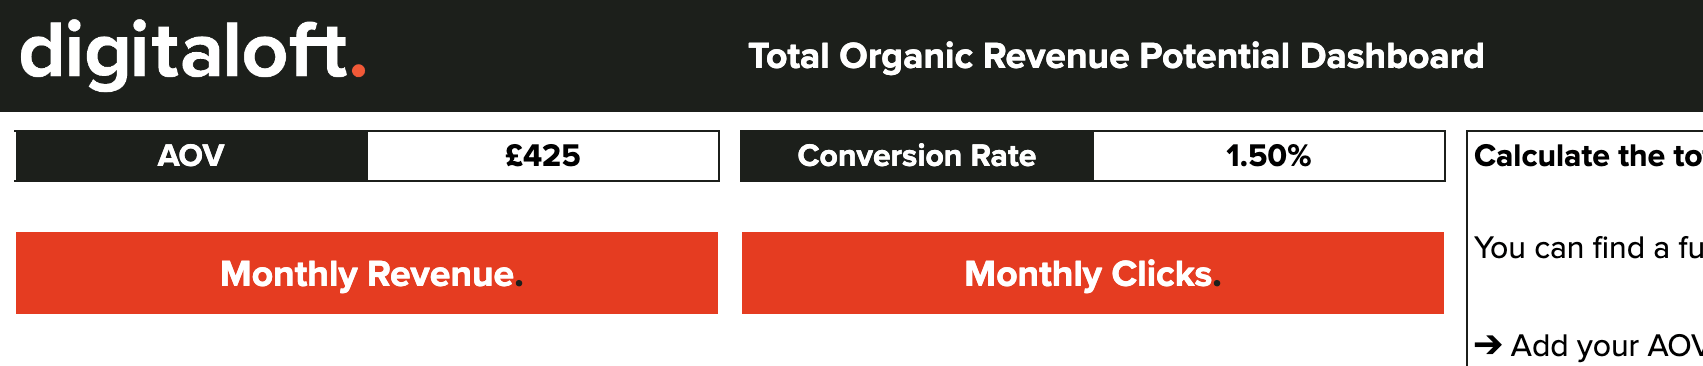
Replace the placeholders, otherwise you’ll be calculating revenue on the wrong figures.
Step 3: Add your categories to the 💰 Total Organic Revenue Potential sheet
Take the category tags you’ve used and replace the placeholders in the ‘Category’ column of the table…
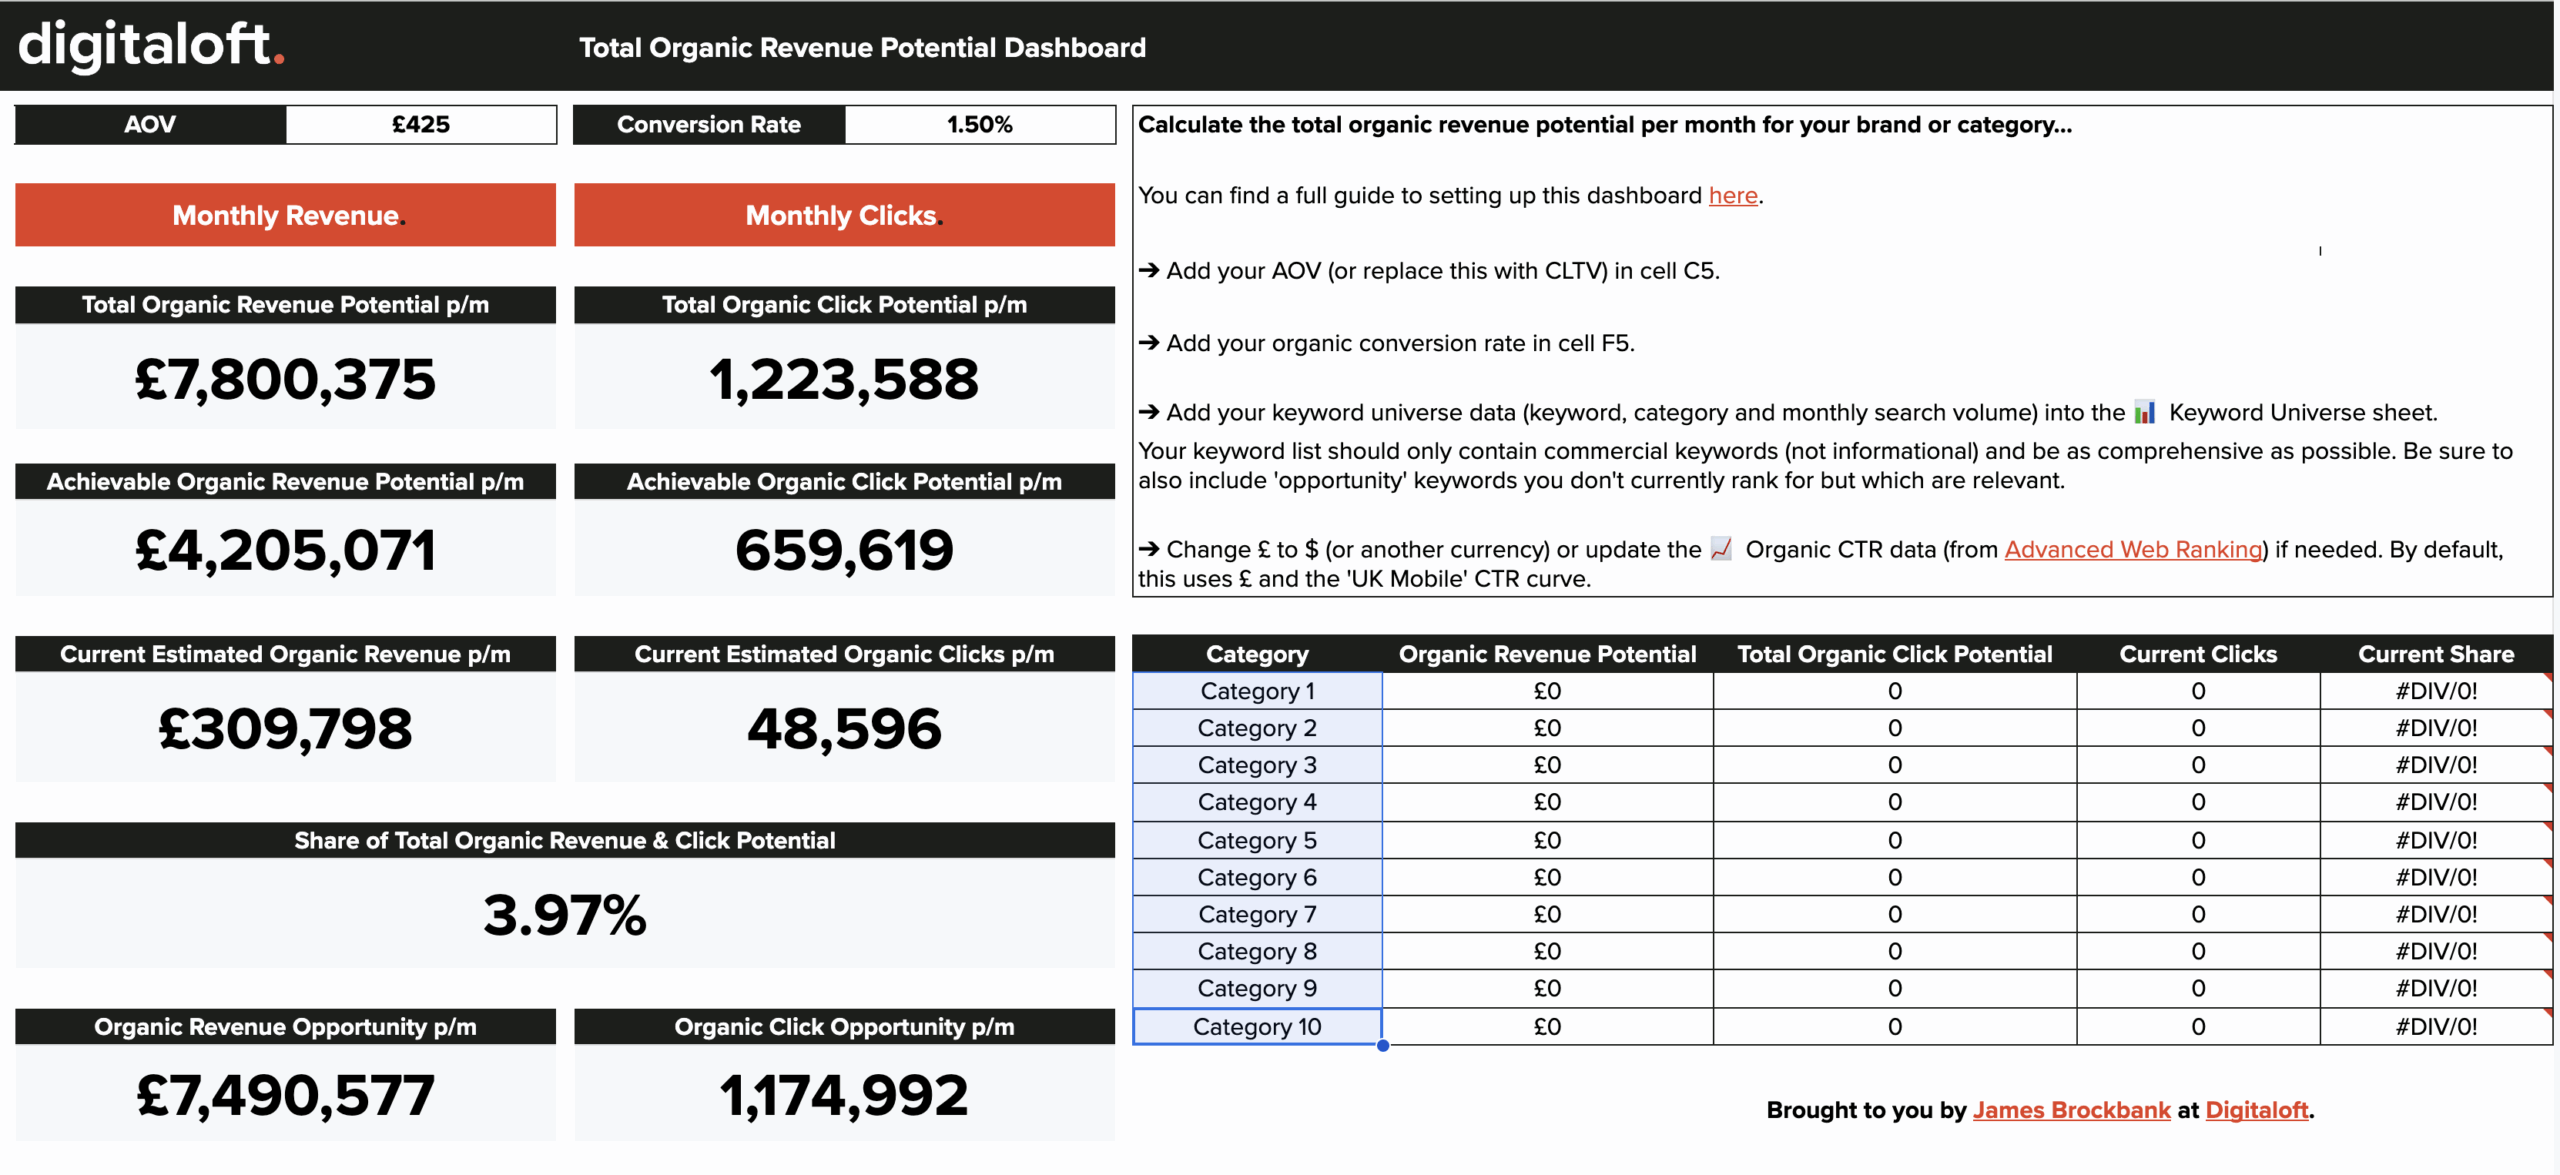
Add these and you’ll see the table auto populate for each category, based on the keyword universe data you added.
Understanding the figures
That’s it.
Here’s what all of the different data points you see on the dashboard tell you:
 | Total Organic Revenue Potential p/m | The total amount of monthly revenue that could be driven if all keywords ranked in position #1. |
 | Achievable Organic Revenue Potential p/m | The total amount of monthly revenue that could be driven if all keywords ranked in top 3 positions. |
 | Current Estimated Organic Revenue p/m | The estimated amount of monthly revenue you’re currently getting from the keywords in the keyword universe. |
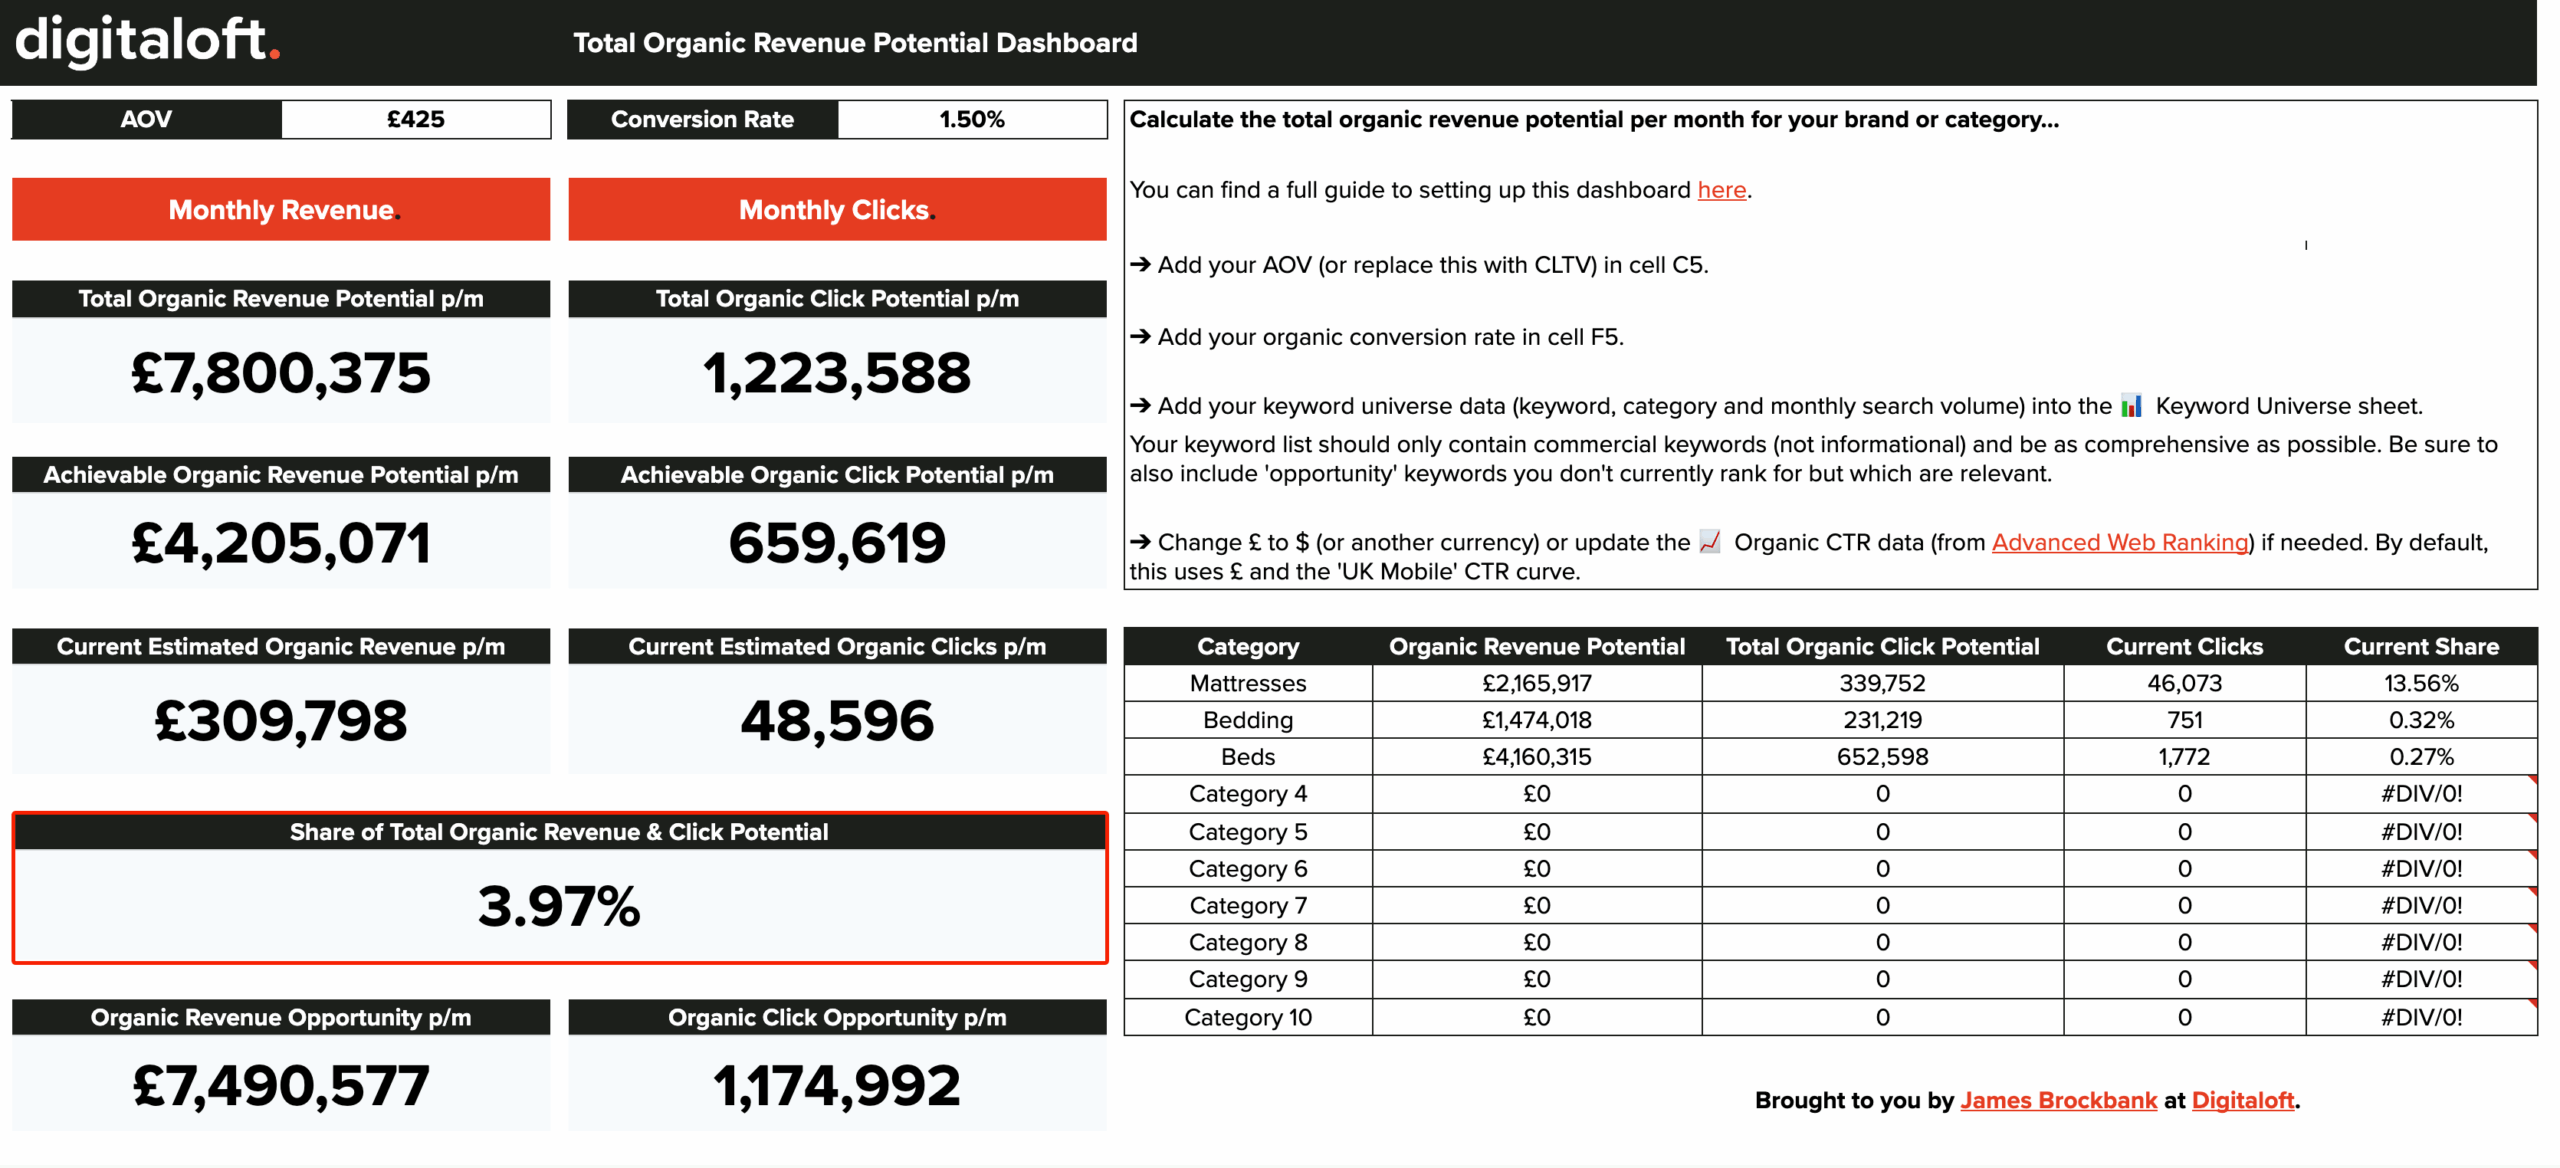 | Share of Total Organic Revenue & Click Potential | The share of the total organic revenue and click potential you’re currently getting. |
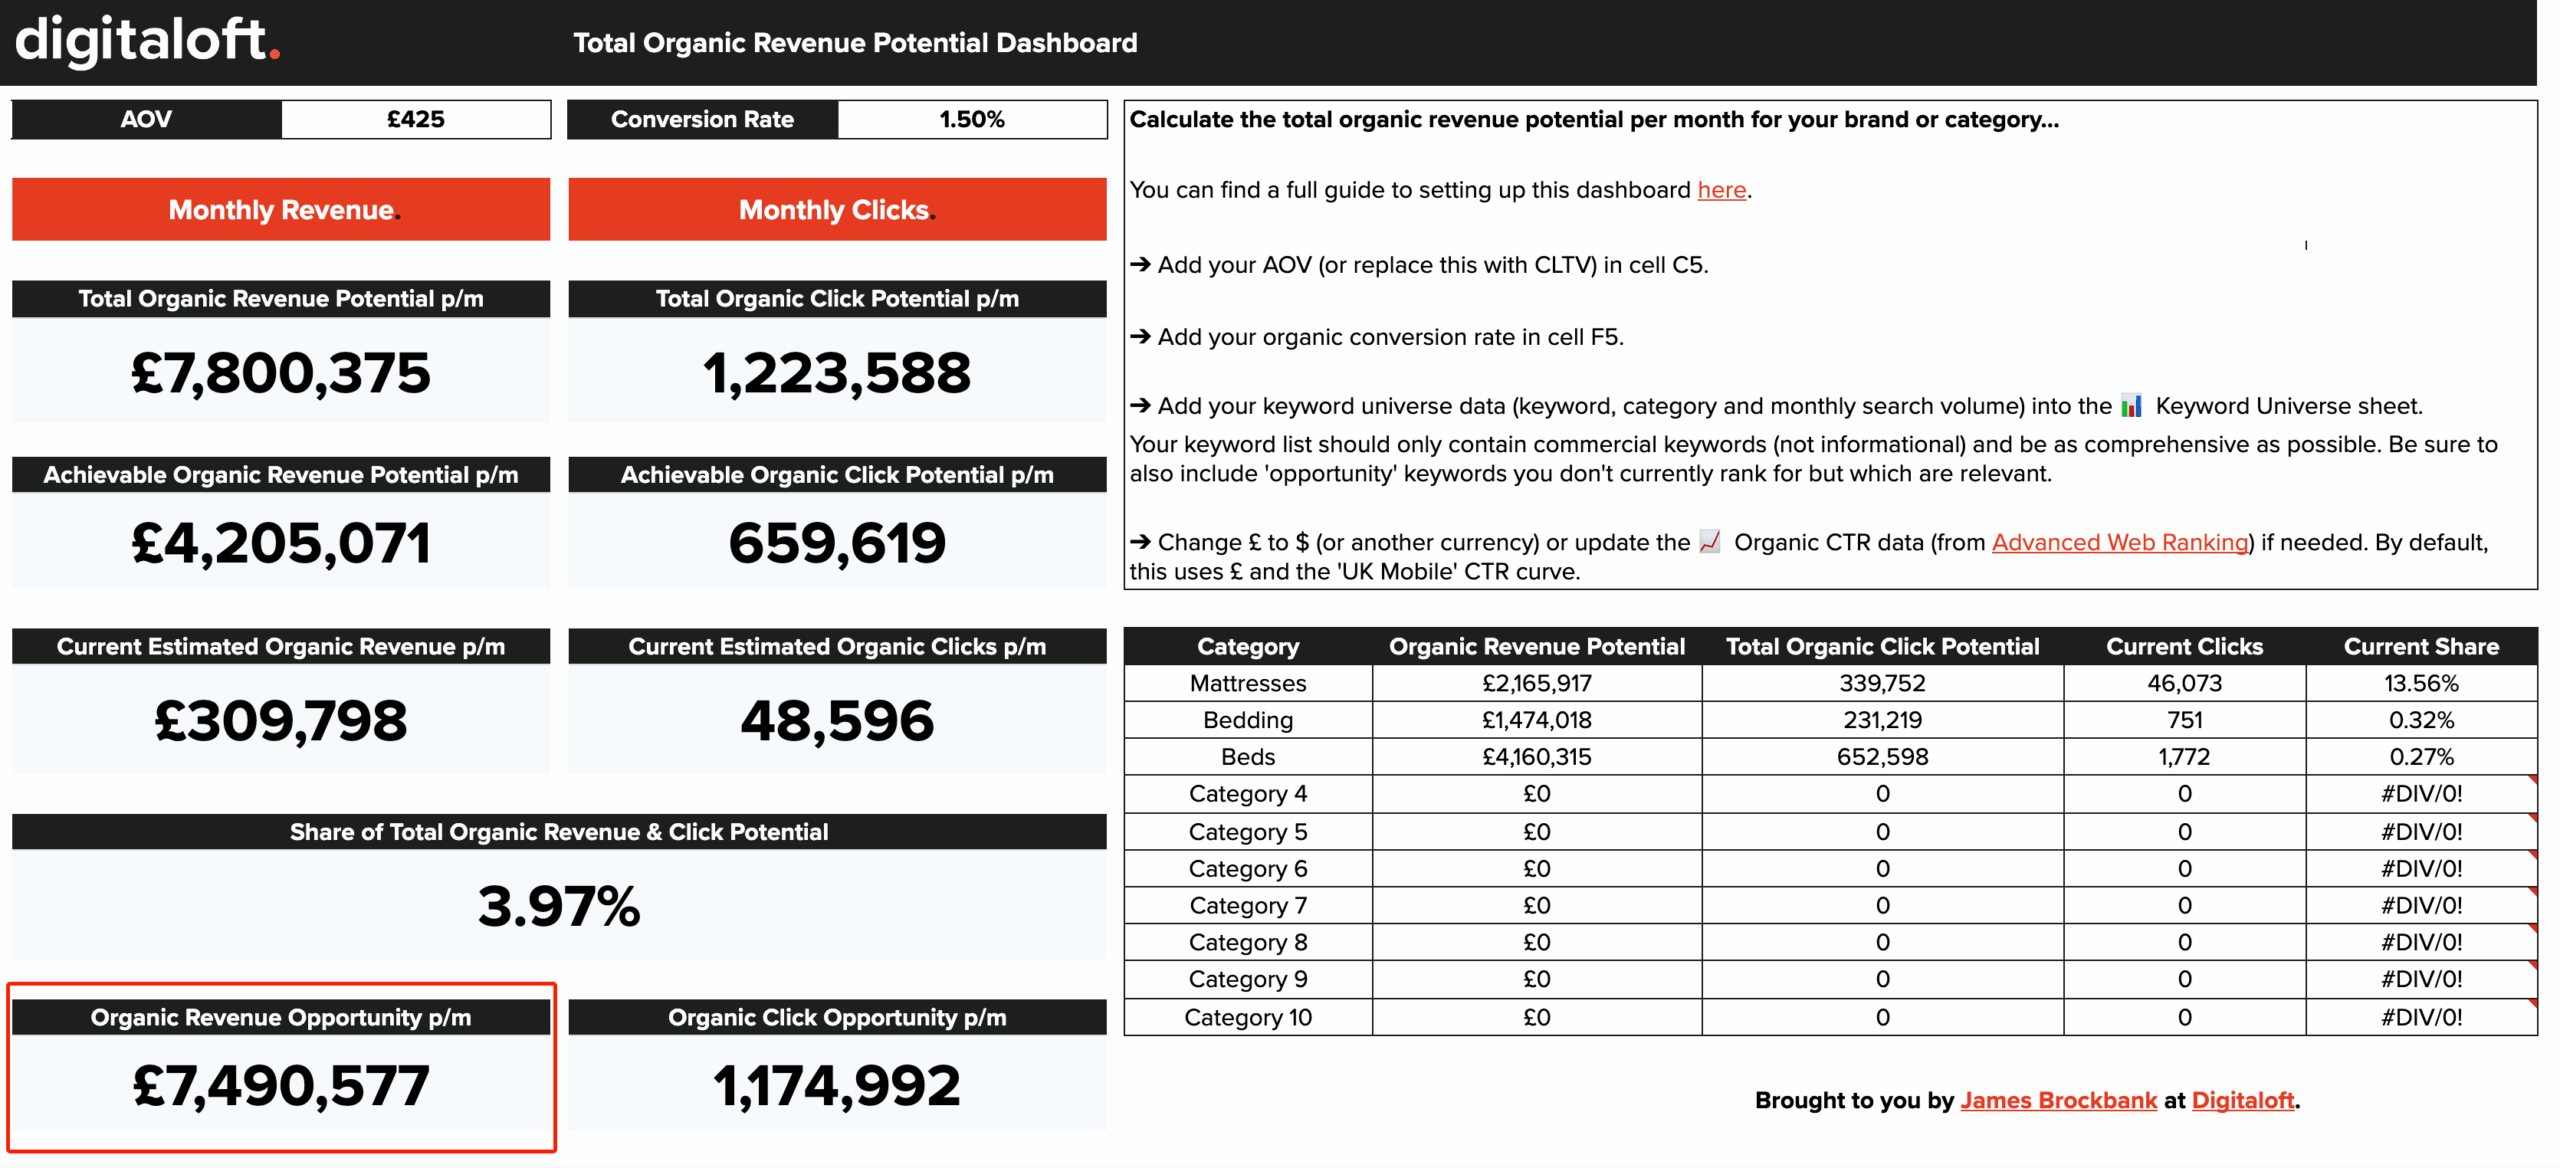 | Organic Revenue Opportunity p/m | The amount of additional organic monthly revenue that’s there for the taking; the gap between what you’re getting now and the maximum you could be getting. |
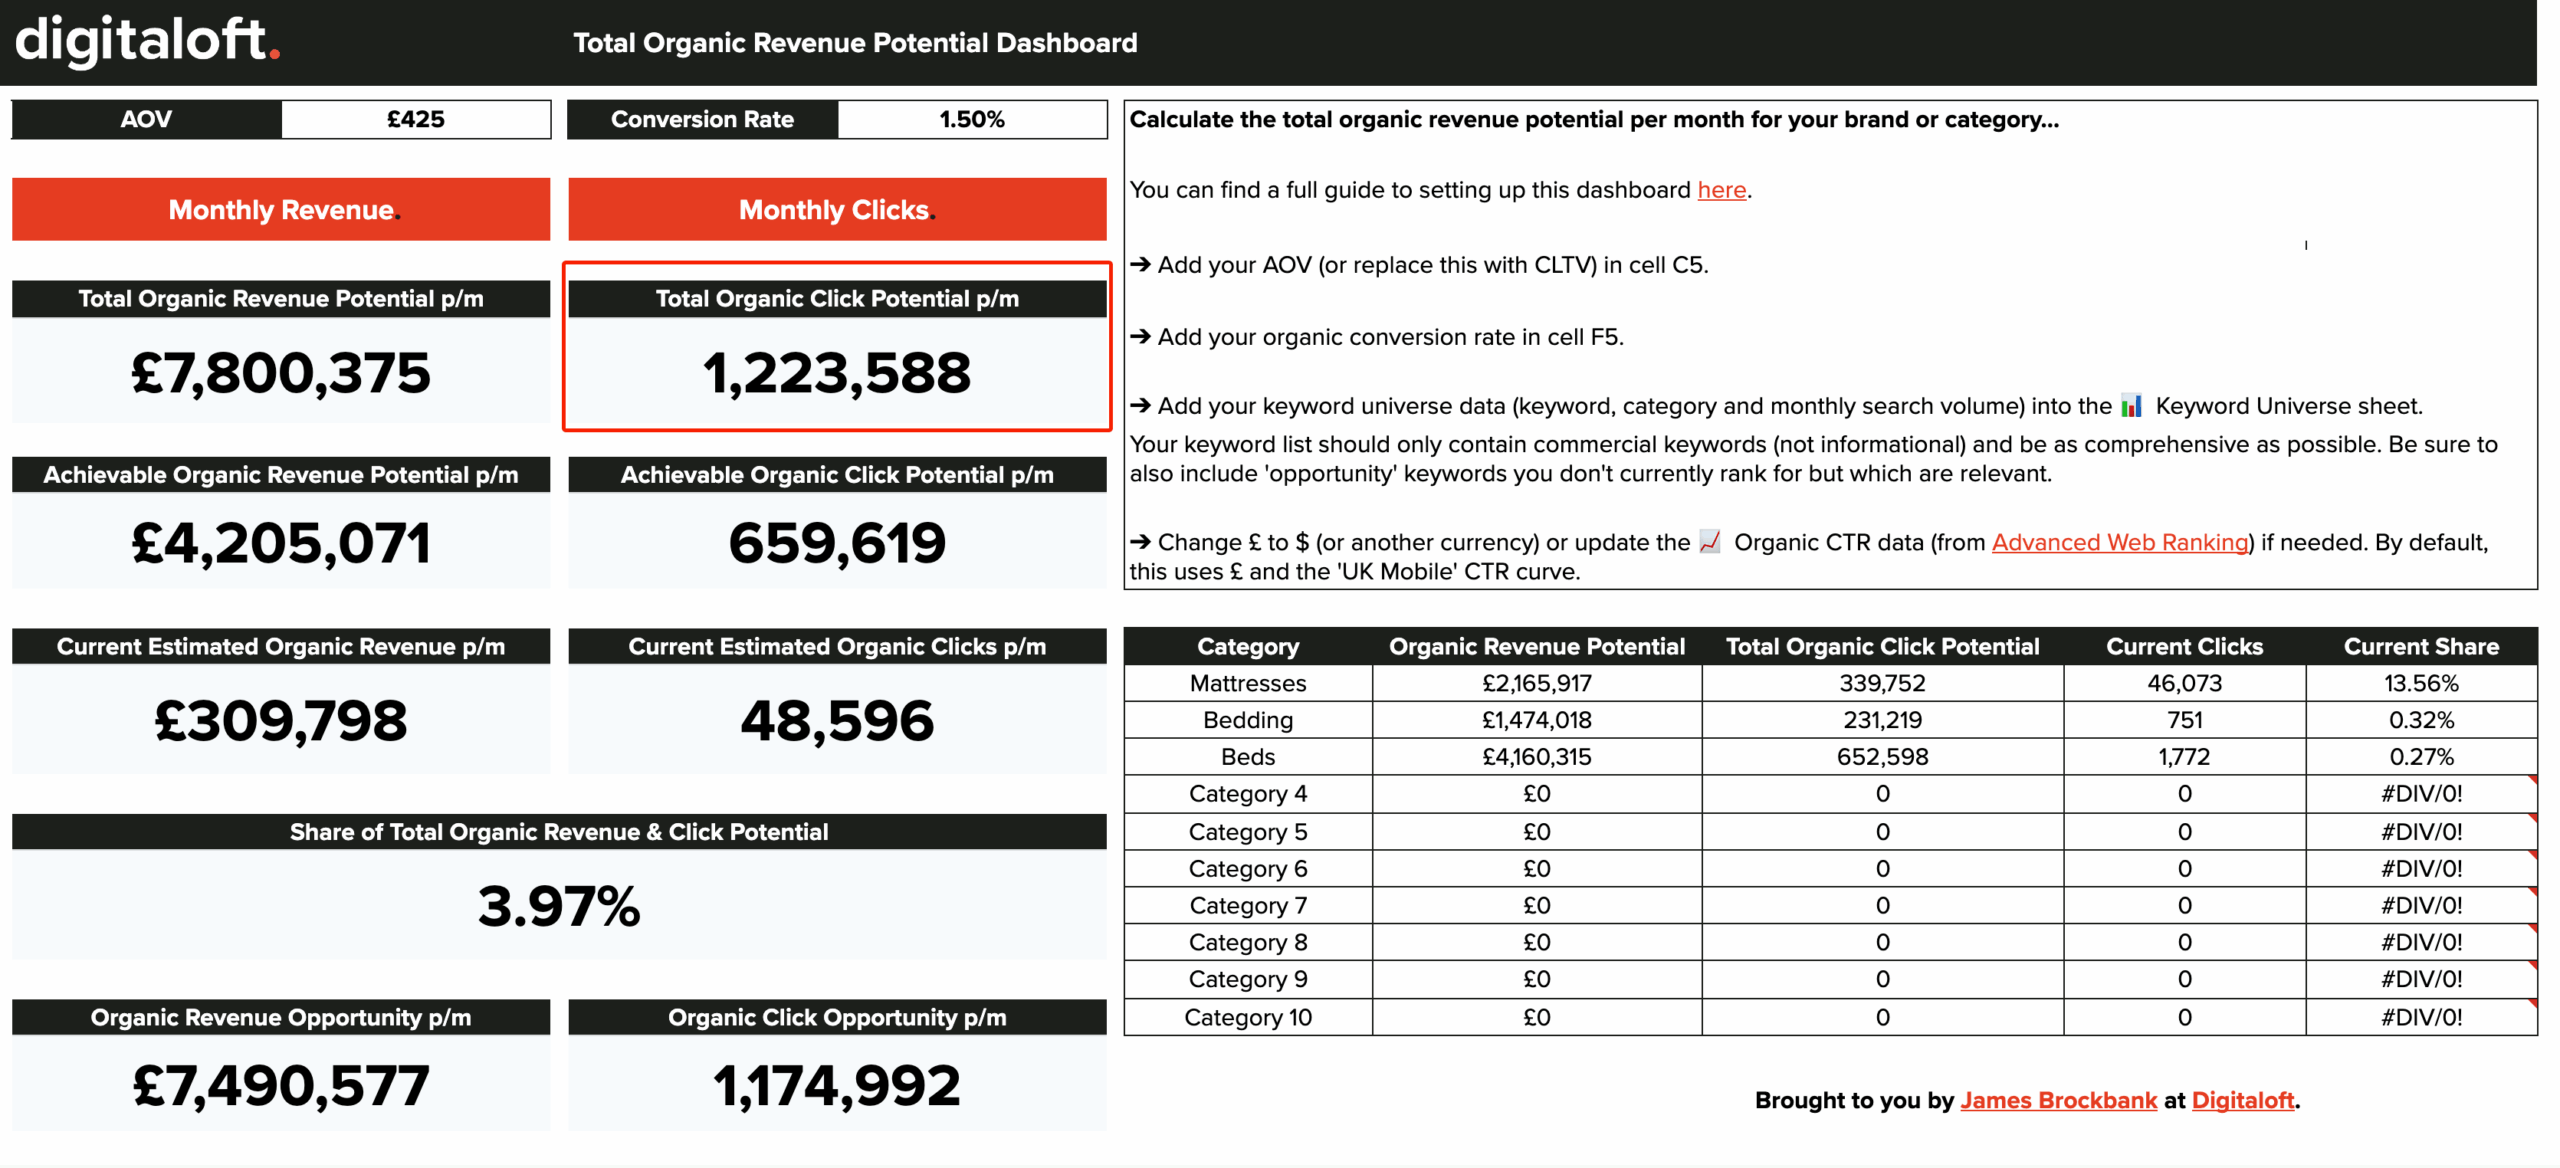 | Total Organic Click Potential p/m | The total amount of monthly clicks that could be driven if all keywords ranked in position #1. |
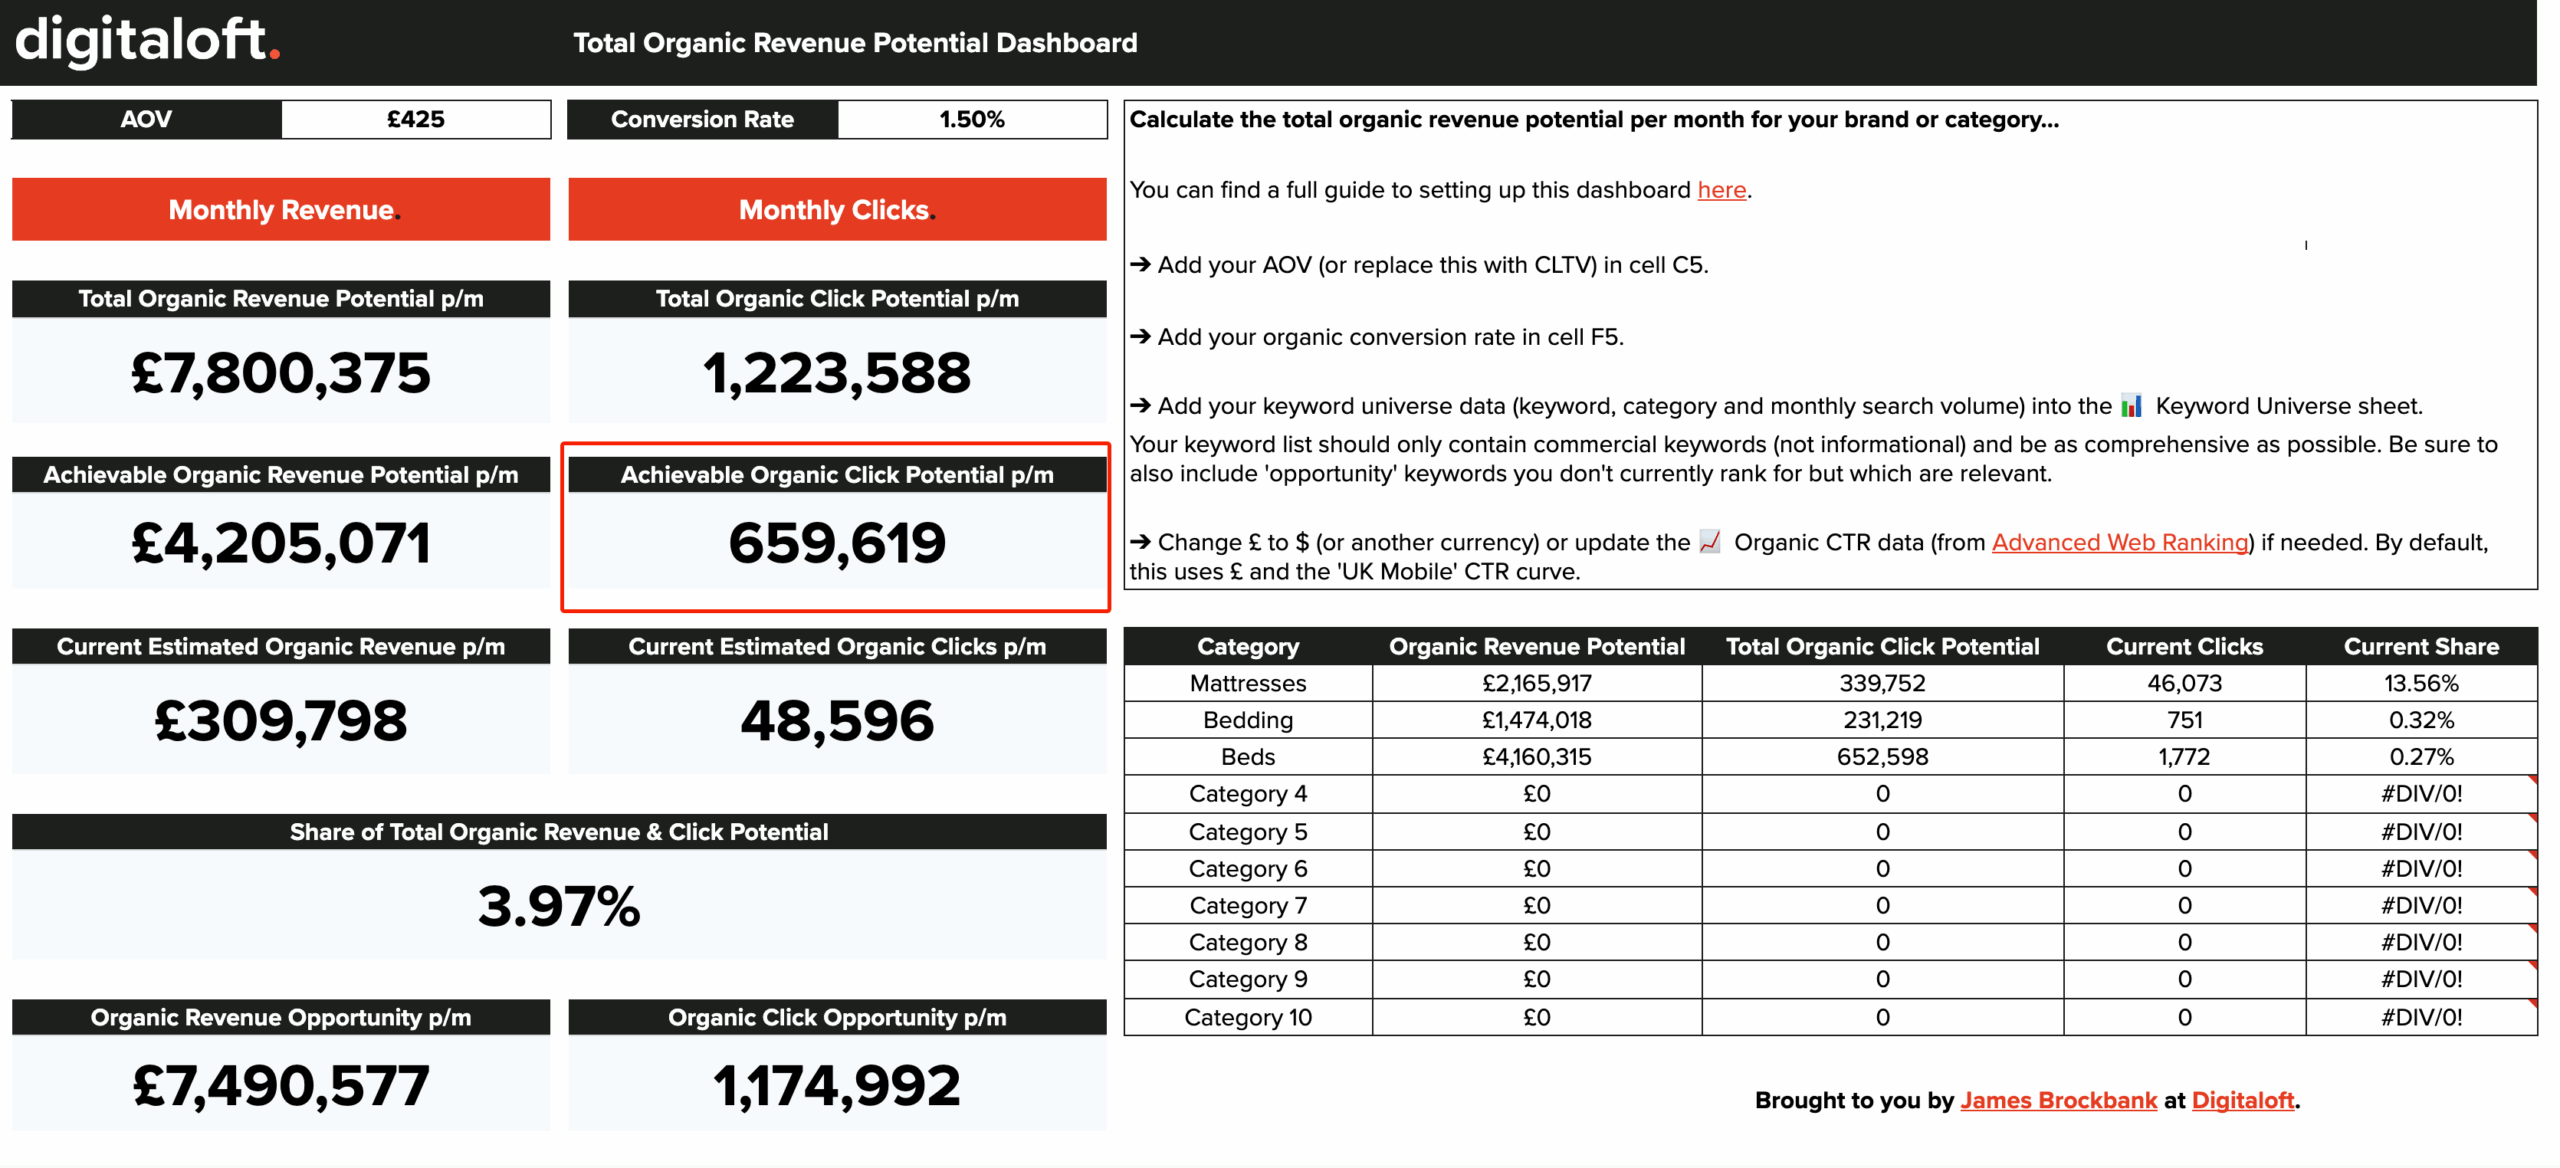 | Achievable Organic Click Potential p/m | The total amount of monthly clicks that could be driven if all keywords ranked in top 3 positions. |
 | Current Estimated Organic Clicks p/m | The estimated amount of monthly clicks you’re currently getting from the keywords in the keyword universe. |
 | Organic Click Opportunity p/m | The amount of additional organic monthly clicks that’s there for the taking; the gap between what you’re getting now and the maximum you could be getting. |
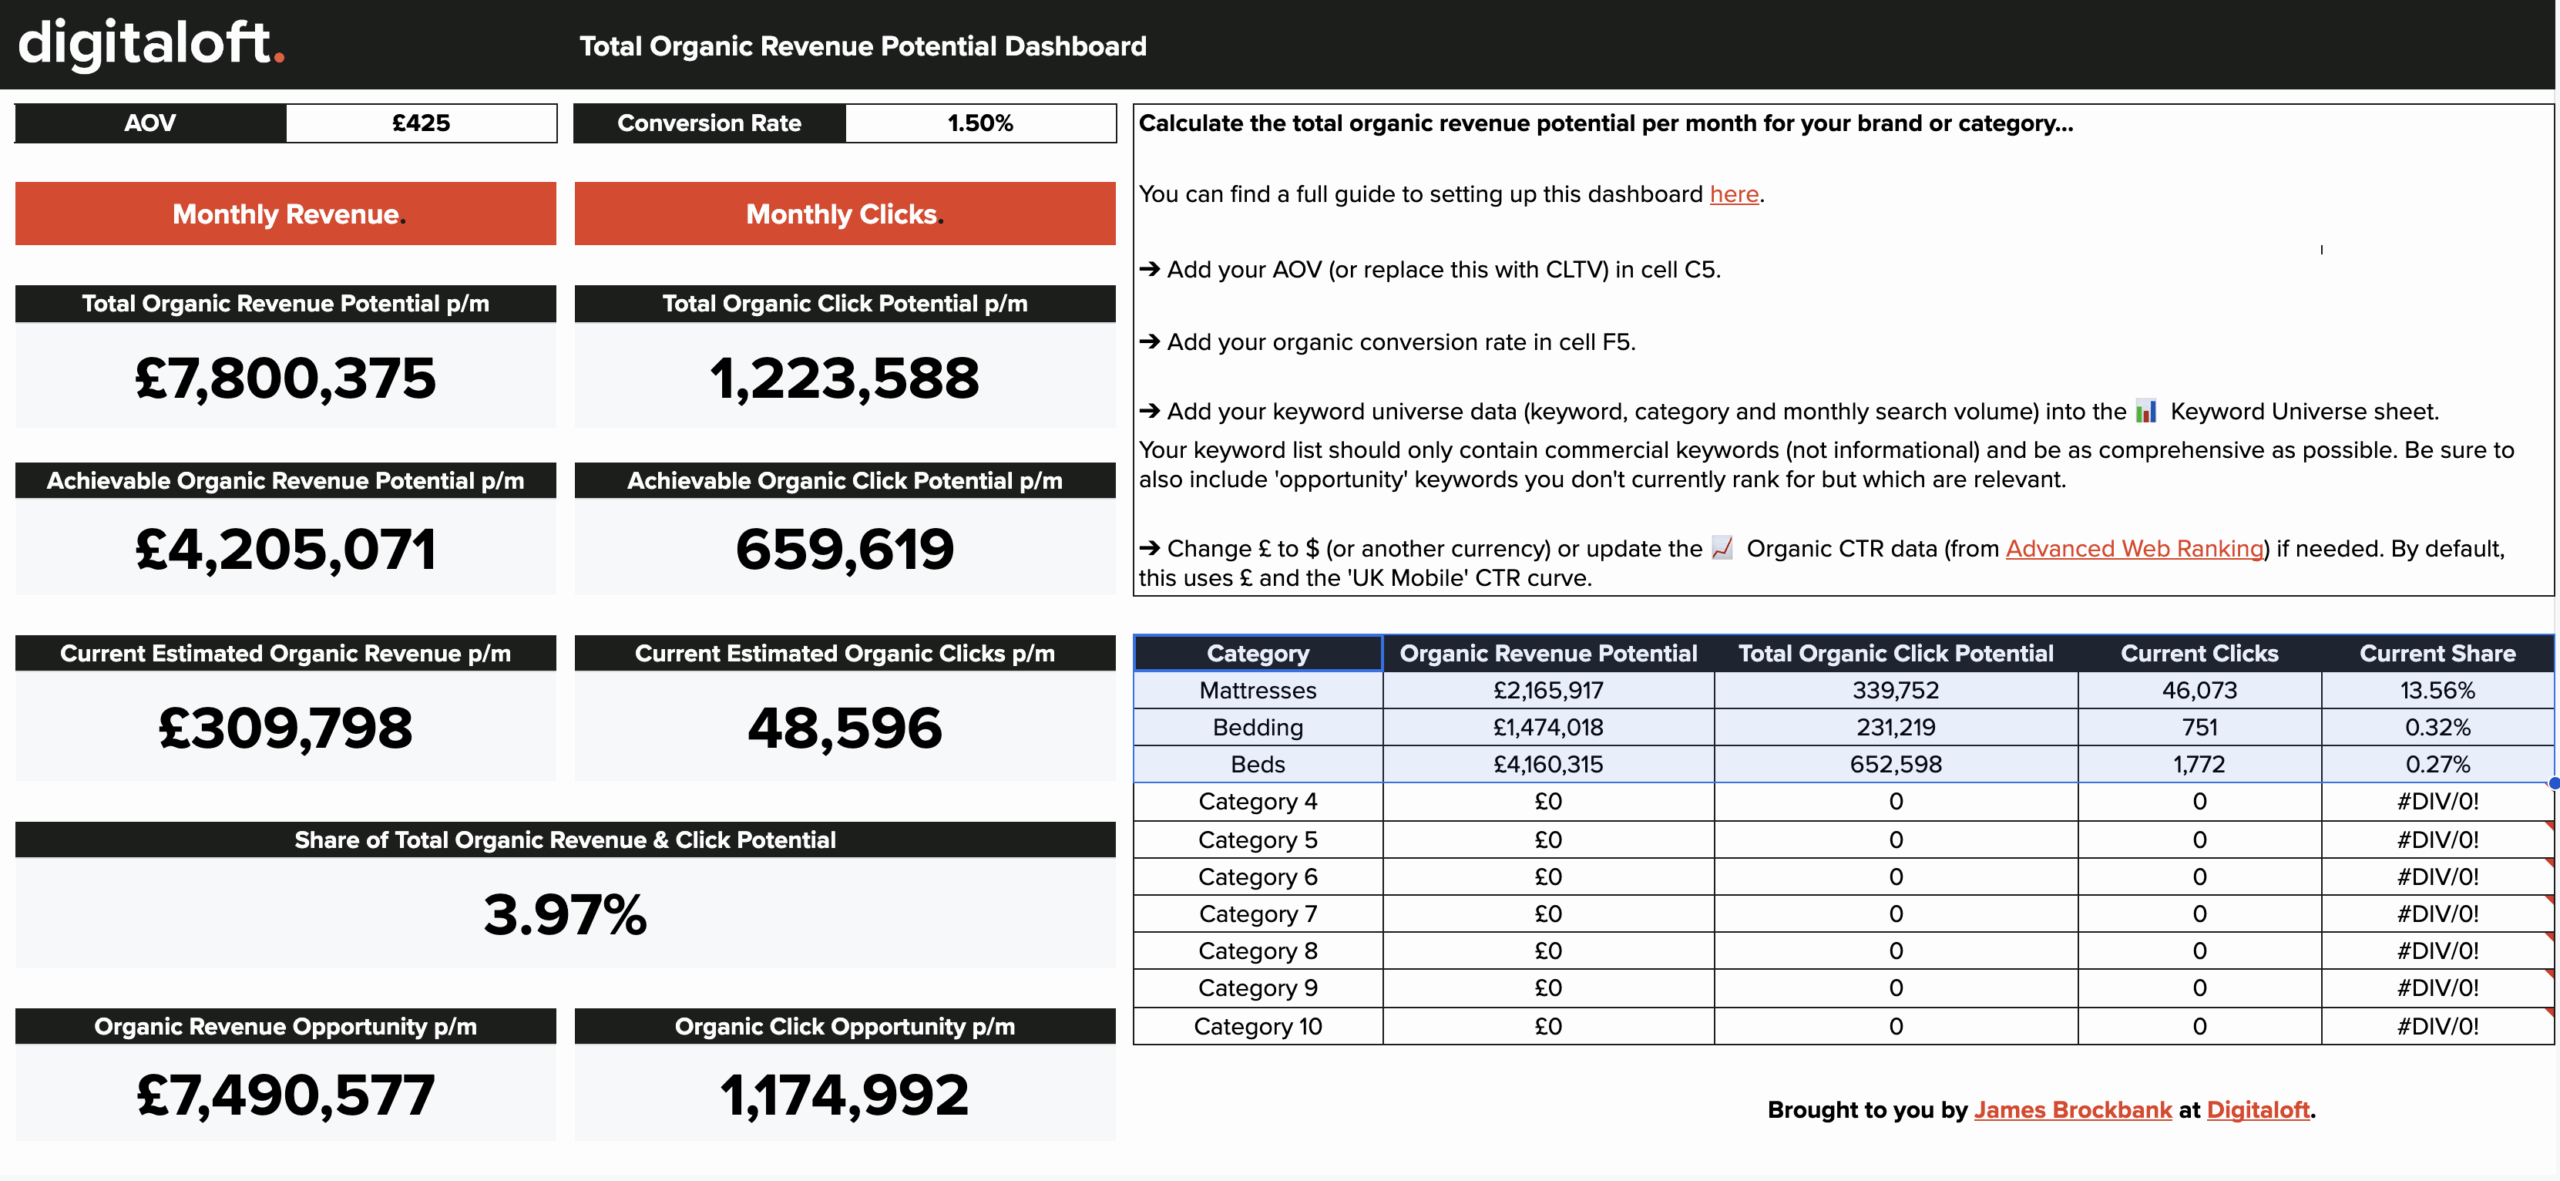
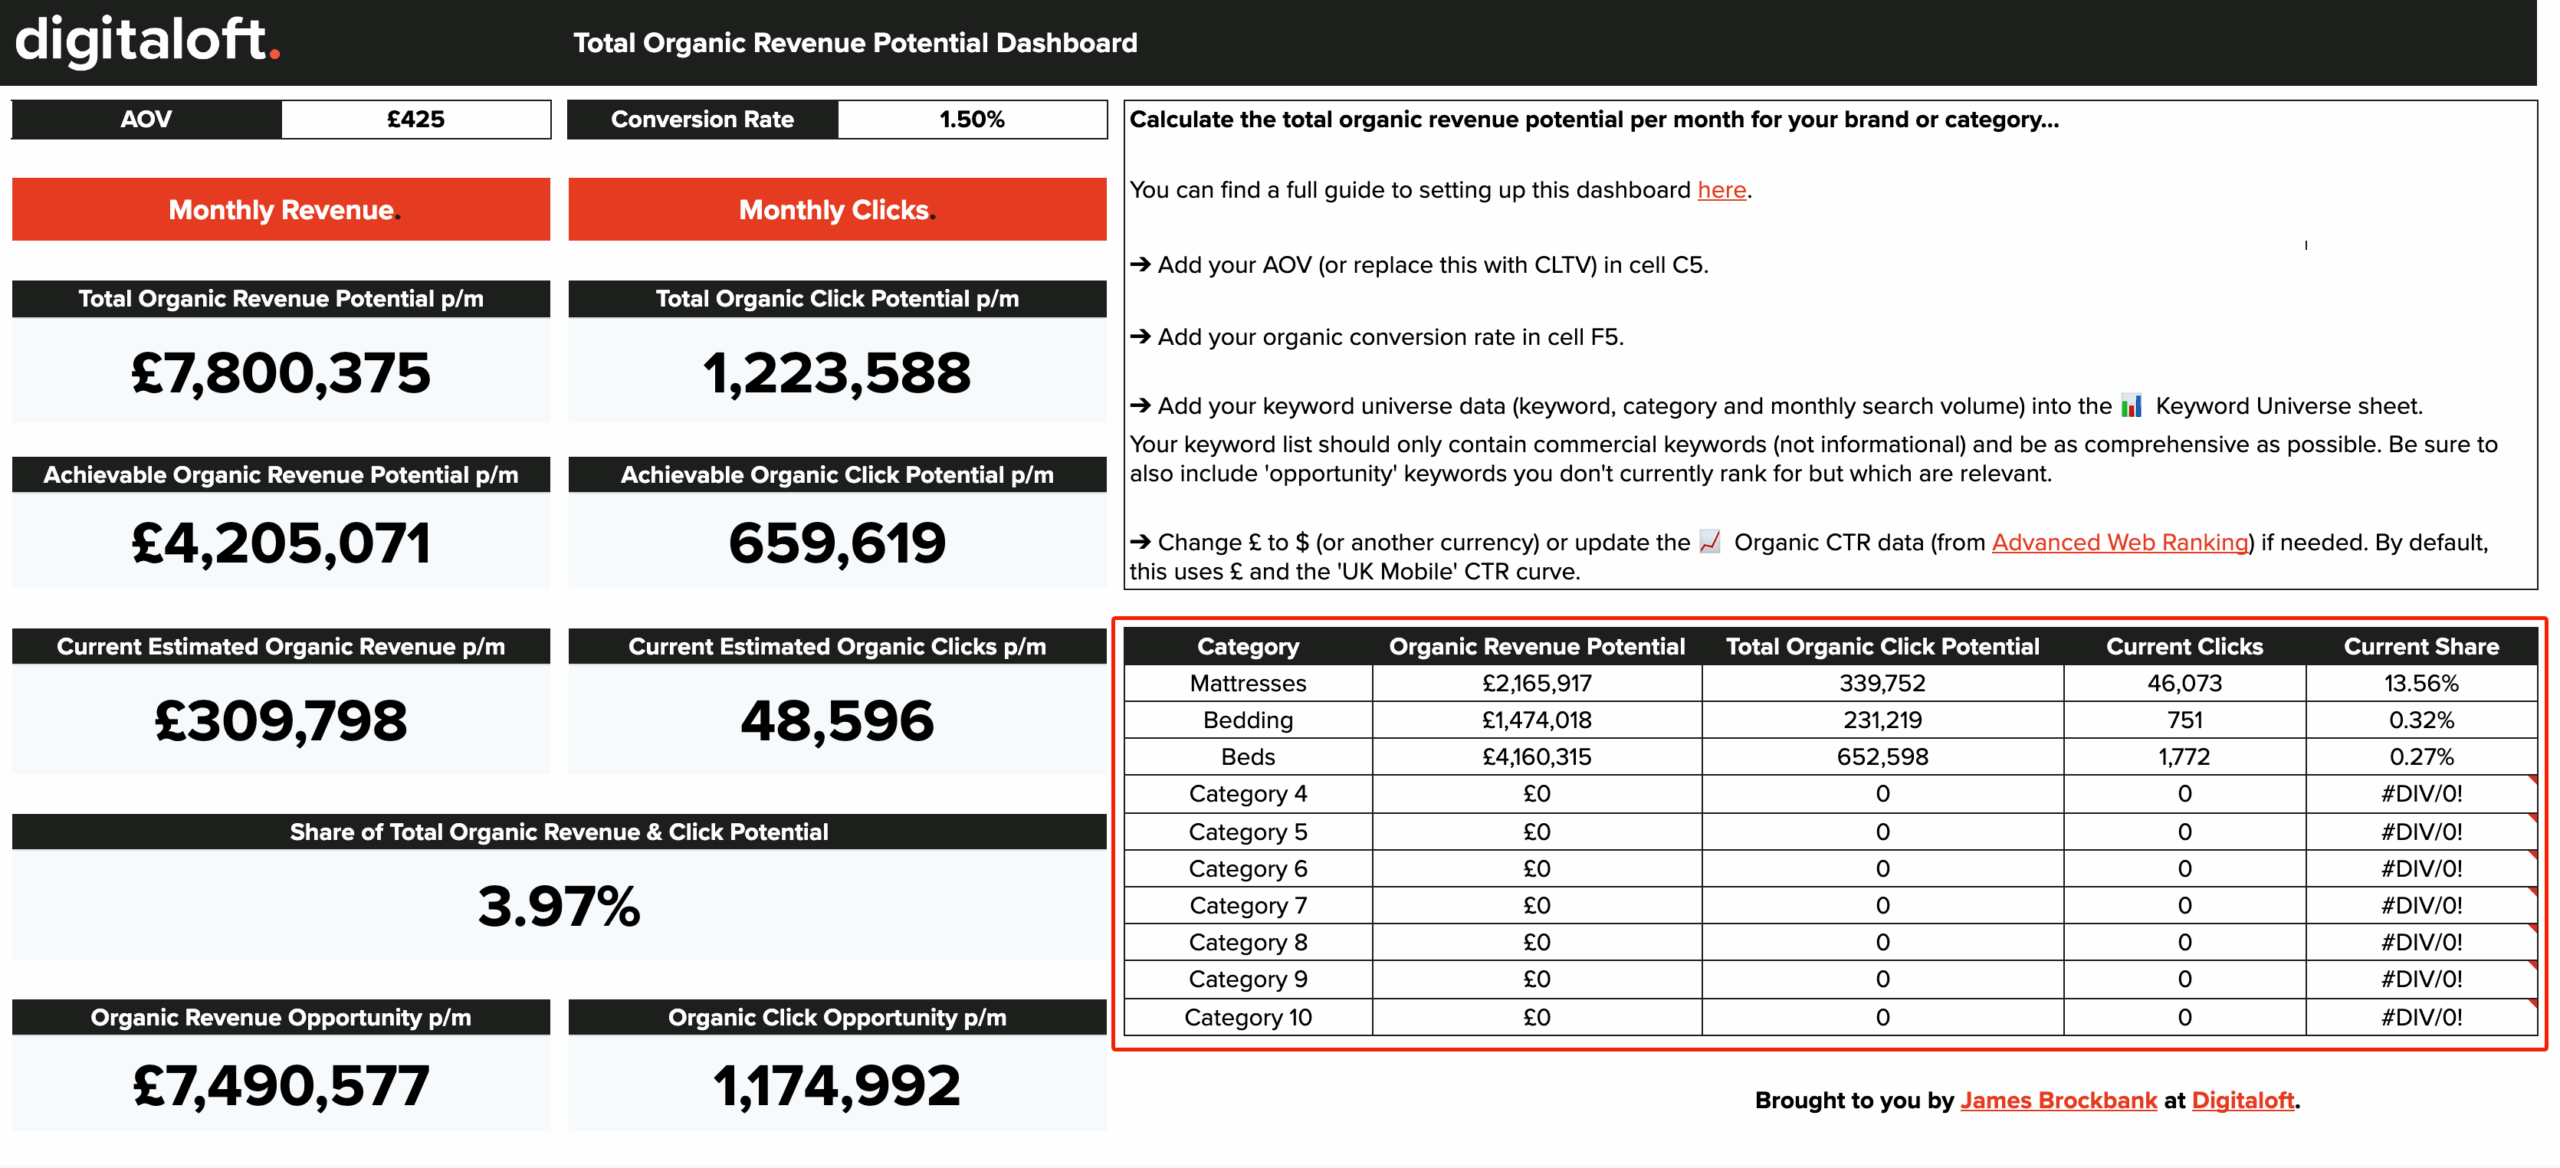 | Category Stats | Key stats for organic revenue and click potential and current share for each category. |
How to use this to unlock investment into organic growth
One of the hardest parts of SEO isn’t knowing what to do; it’s getting the budget, resources, or internal buy-in to do it.
That’s where this number becomes your strongest commercial weapon.
When you can walk into a room and say, “There’s £15.8m in achievable organic revenue up for grabs, and we’re currently capturing just 23% of it,” the conversation shifts. You’re no longer talking about rankings or traffic, you’re talking about money left on the table.
Opportunity cost.
Growth potential.
Here’s how to use it effectively:
1. Anchor your case for investment in numbers the business cares about
Revenue potential helps you speak the language of decision-makers.
Whether you’re asking for more content budget, development resources, or investment into digital PR, numbers like this give context and weight. You’re not just making a request; you’re presenting a business case backed by upside.
2. Show the gap between potential and current performance
It’s not enough to show the size of the opportunity, you need to highlight the gap.
If your current share is 12% of the achievable potential, what would it take to get to 20%? What’s that worth in incremental revenue? That delta becomes your justification for change.
3. Frame SEO as a growth channel, not a cost centre
By presenting SEO as a lever to unlock X% of a defined revenue opportunity, you’re repositioning it from a line item on a marketing budget to a core driver of business growth. That changes how stakeholders view investment in it.
4. Tie proposed activity to impact on share growth
If you’re asking for budget to drive organic growth, and to put into key initiatives, show how those initiatives will help grow your share of organic revenue potential. Make it clear what that increased share would be worth, in real numbers.
5. Use it to justify long-term thinking
SEO isn’t an overnight channel.
But when you show the total upside over 12+ months, you create space for longer-term investments.
You’re saying: “If we do this right, we can unlock £X million in the next year, but we need to start now.”
This number doesn’t just help you understand your opportunity. It helps you sell it; to your boss, your board, or your clients.
And that’s when things start to move.
The most valuable number you’re probably not using
Most SEO strategies still hinge on rankings, traffic, or vague growth goals.
But none of those things speak directly to the boardroom. None of them make a compelling case for serious investment.
Total organic revenue potential does.
It’s the number that reframes SEO as a commercial opportunity. It helps you quantify what’s at stake, prioritise the right areas, and track the share you’re capturing; all in a way that aligns with how the business thinks about growth.
If you’re not already calculating this, start.
Even a rough estimate will give you a clearer view of what’s possible and where you stand today.
It’ll make:
- Your SEO strategy prioritised around the right areas
- Your stakeholder conversations and updates easier
- Your ability to unlock budget and resources stronger
Because the brands winning in organic search aren’t just working harder, they’re working with a clearer picture of the upside.
And that starts with this number.