
Your competitors are capturing revenue that should be yours.
We’ll put you in front of your future customers in the exact moments they're deciding what to buy and who to buy it from; making sure it's you they find, not your competitors.
We don’t do average.

How we earned 75+ hyper-relevant media placements for Booking.com for Business

How an integrated approach to SEO and Digital PR boosted Harley Street Skin Clinic’s organic traffic by 155%

Using product PR to increase AI search visibility for Emma

How our integrated SEO & digital PR strategy smashed Black Friday traffic & revenue forecasts for Christmas Tree World

How we earn 20+ hyper relevant links on autopilot every month for B2B lead generation experts Sopro
What we do...
We get you found in buying searches, the ones made by people ready to buy, across traditional, AI and social search.
We use SEO to capture existing demand and make sure it flows to you, not your competitors, and we bring together technical SEO, content and digital PR to drive that visibility.
Partner with us on an end-to-end SEO programme or use one or more of our standalone search services to strengthen your in-house capabilities.
Search makes up many of the most influential moments in the buyer journey.
Search makes up many of the most influential moments in the buyer journey.
People turn to search to find and compare their options and choose what to buy and who to buy from.
But if you’re not visible in these searches, much of the demand every other marketing channel creates flows to the brands who are.

The only thing that’s not changing in search is that you need to make money from it.
The only thing that’s not changing in search is that you need to make money from it.
Revenue is the only true measure of SEO success. Everything else is progress or vanity metrics.
Search is changing fast; with people searching more places than ever before. But none of that matters if it doesn’t make you money.
We get you found when it counts.
We get you found when it counts.
Some searches drive traffic that makes you money. Many don’t. We’ll get you found in the ones that do.
We’re comfortable talking about how much money we’re making you, and kickstart every engagement by showing you what you’re missing out on by not being visible and track progress against this each month.
The Buying Search Framework.
The Buying Search Framework is our proprietary SEO methodology that’s built to capture more revenue from search by getting them found when and where people are searching to decide what to buy and who to buy it from.
It’s how we connect traditional and AI search visibility directly to commercial demand, showing how much revenue is available, where it sits, and how to win more of it.
Don't just take our word for it.
Here's what the brands who trust us with their growth have to say about partnering with Digitaloft.
“Digitaloft stood out for how quickly they understood our challenges and where digital PR could drive impact.”

Rich Brown
Prep Kitchen
“Our collaborative approach means we consistently produce results, earning quality, relevant coverage.”

Natalie Wolfenden
JD Outdoors
“Digitaloft's campaigns consistently target topically relevant placements that move the needle on rankings and revenue in competitive markets.”
Alex Galinos
Hoppa
“Digitaloft actually knows what they're doing, and have proven results again and again for us.”

Rachel Entwistle
Wander
“Digitaloft's work has driven rapid growth, playing a crucial role in achieving our company goals and successfully launching into the US market.”

Joshua Duggan
Opera Beds
“Digitaloft is one of the, if not THE most strategic, organised, consistent and responsive teams I've worked with. ”

Vic Heyward
Sopro
We’re trusted by specialist brands like…


Our beliefs.


1) Revenue is the only true measure of SEO success, and that anything else is progress or vanity metrics. To make more money for our clients, we must know how, and where, we can influence revenue growth and put the pressure on ourselves to deliver against this.
2) SEO is most effective when it’s used to capture existing demand. Unlike many other marketing channels, it can put you in front of people actively searching for what you sell; at the exact moment they’re deciding what to buy and who to buy it from.
3) Search is changing at a rapid pace right now. New searchable platforms will continue to emerge, many powered by AI, and our clients will need to be found in some of these. We must move faster than our clients and put ourselves in a position to help them navigate change.
4) Specialist brands are best-placed to win at search today, tomorrow and in the future. Specialist doesn’t mean small, it means focussed. These brands know exactly who they serve, what they stand for and what they do better than anyone else. They’re the best choice for their customers, and we help them become the obvious one, too.
These beliefs shape everything we do.
They keep us focused on what matters most to our clients, and allow us to operate with the speed, clarity and commercial discipline they expect from an agency partner.
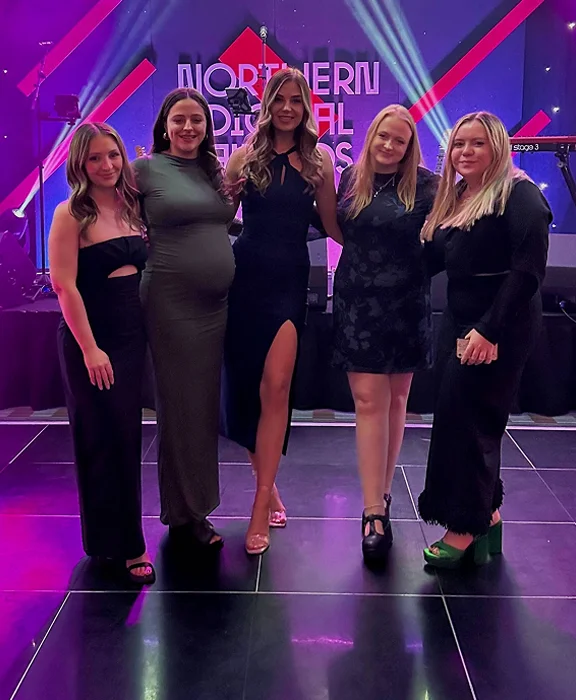
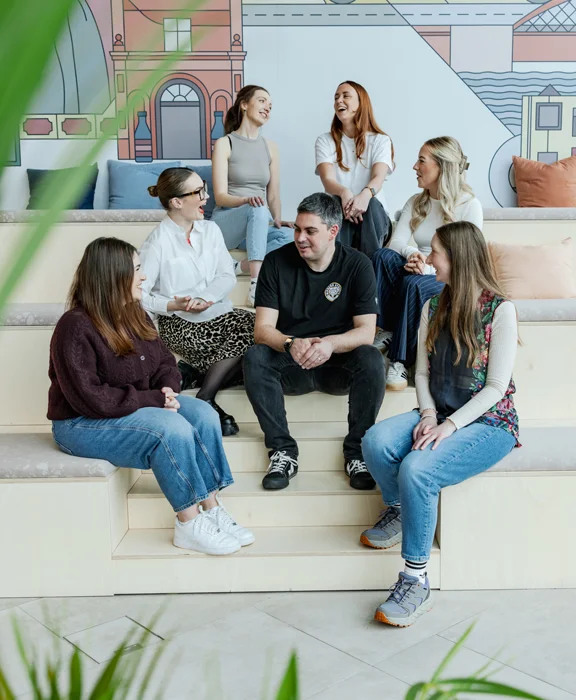
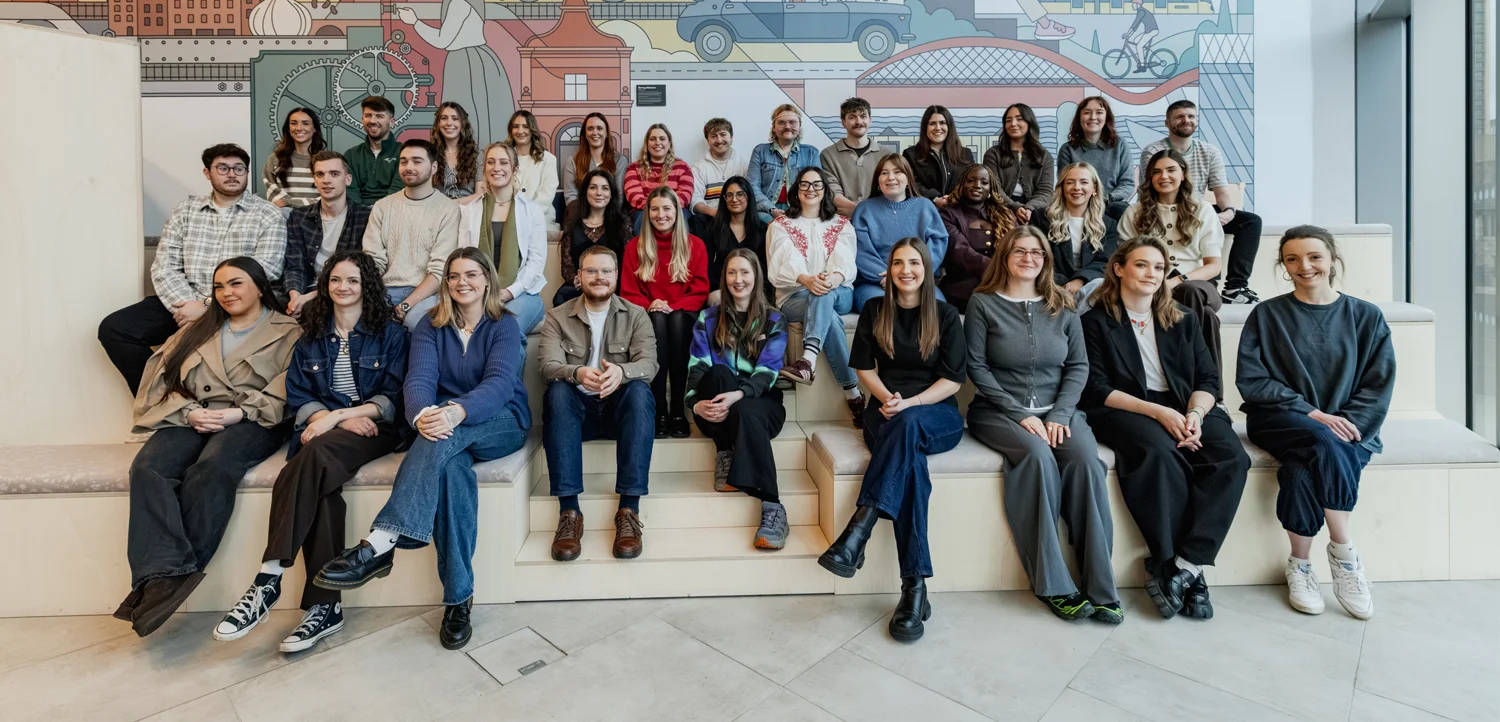
Meet the team.
Great work doesn't happen by accident. Meet the people getting our clients found and chosen when it counts.

Alex Minion

Amy Gibson

Anna Gardner

Becky Lindsay
Beth Crowe

Caitlin Lloyd

Charlotte McManus

Chloe Meadows

Damien Horwood

Elana Anthony
Our insights.
View all insights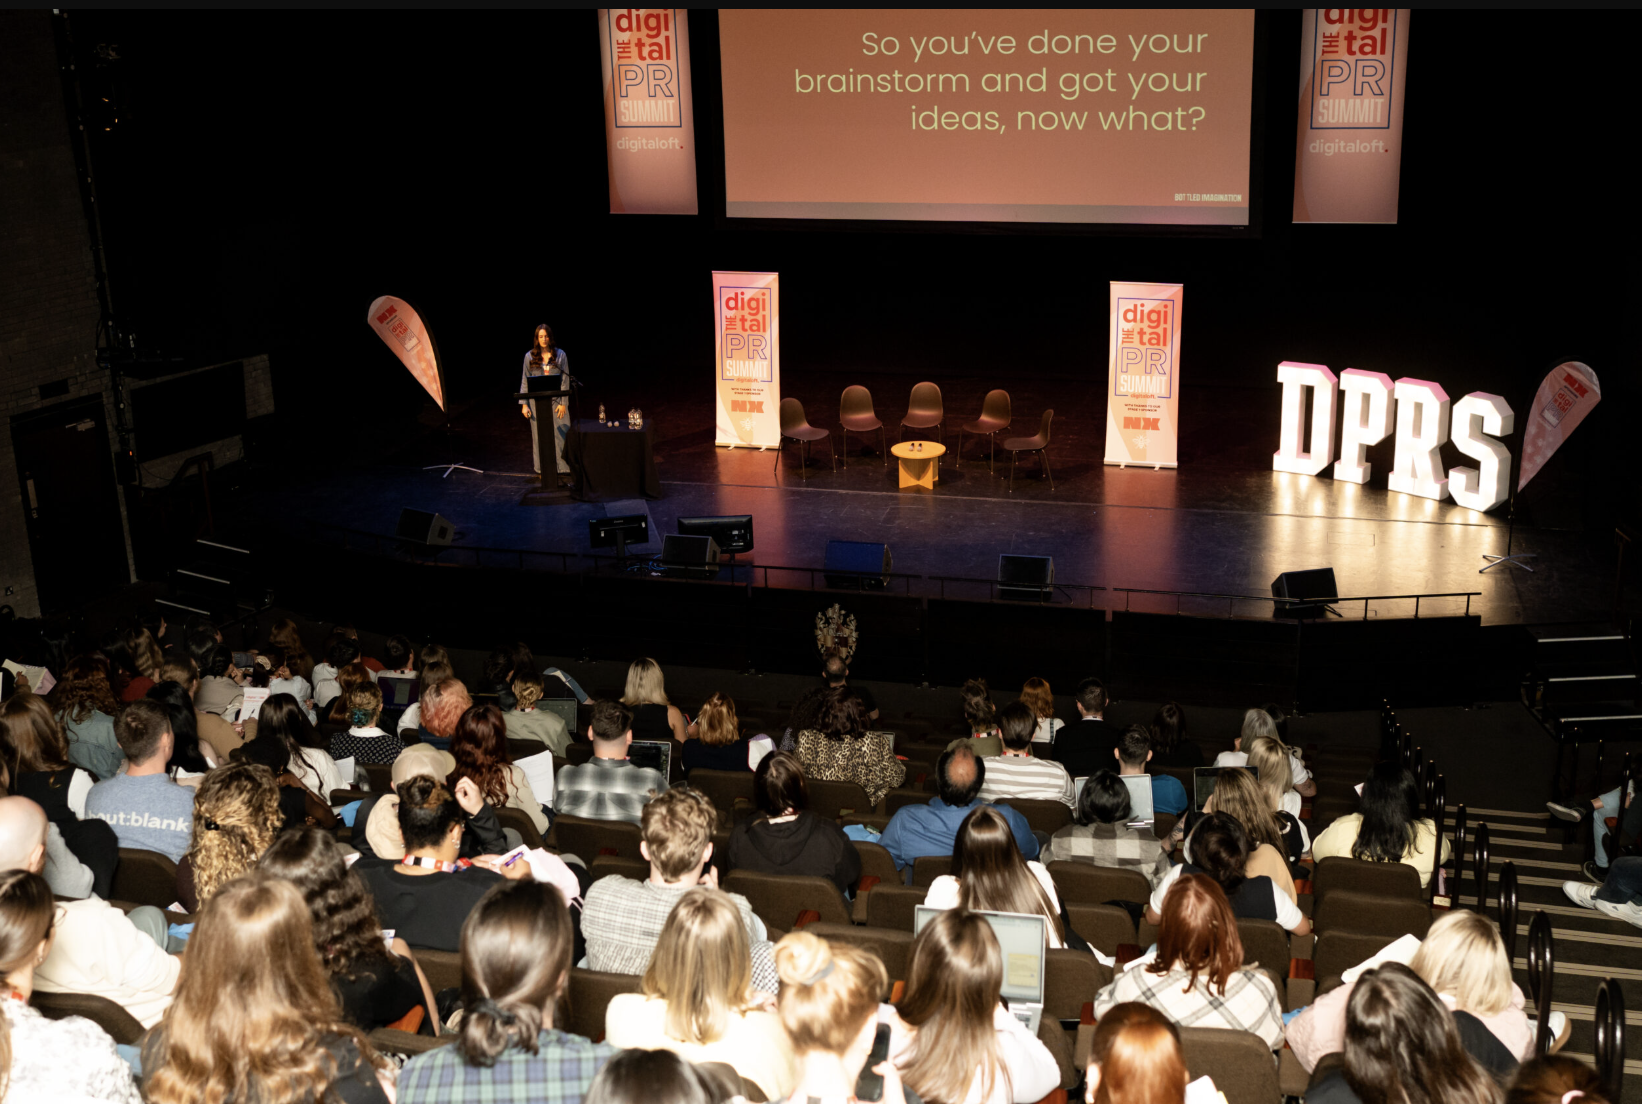


Digitaloft wins ‘Standout B2C SEO Campaign of the Year’ at the UK Digital Excellence Awards
Our insights.
4 min read
9 of the best PR and communications conferences and events to attend in 2026
4 min read
Digitaloft wins ‘Standout B2C SEO Campaign of the Year’ at the UK Digital Excellence Awards
4 min read
13 copywriting frameworks you need to know to write content that converts
Ready to get found in the searches that shape buying decisions?
Let's talk